reading-notes
This Repo required for Asac labs class 2
Project maintained by ManarAbdelkarim Hosted on GitHub Pages — Theme by mattgraham
Matplotlib
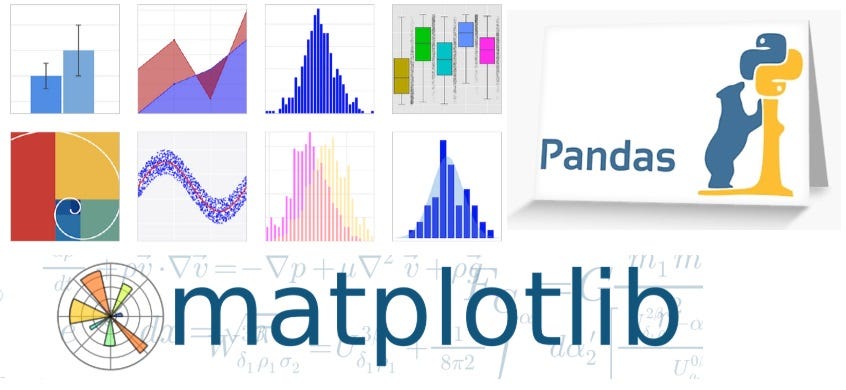
What is matplotlib?
matplotlib is probably the single most used Python package for 2D-graphics. It provides both a very quick way to visualize data from Python and publication-quality figures in many formats. We are going to explore matplotlib in interactive mode covering most common cases.
IPython and the pylab mode :
is an enhanced interactive Python shell that has lots of interesting features including named inputs and outputs, access to shell commands, improved debugging and much more. When we start it with the command line argument -pylab (–pylab since IPython version 0.12), it allows interactive matplotlib sessions that have Matlab/Mathematica-like functionality.
pyplot :
provides a convenient interface to the matplotlib object-oriented plotting library. It is modeled closely after Matlab(TM). Therefore, the majority of plotting commands in pyplot have Matlab(TM) analogs with similar arguments. Important commands are explained with interactive examples.
seaborn tutorial

What is Seaborn?
Seaborn is a library for making statistical graphics in Python. It is built on top of matplotlib and closely integrated with pandas data structures.
some of the functionality that seaborn offers:
-
A dataset-oriented API for examining relationships between multiple variables
-
Specialized support for using categorical variables to show observations or aggregate statistics
-
Options for visualizing univariate or bivariate distributions and for comparing them between subsets of data
-
Automatic estimation and plotting of linear regression models for different kinds dependent variables
-
Convenient views onto the overall structure of complex datasets
-
High-level abstractions for structuring multi-plot grids that let you easily build complex visualizations
-
Concise control over matplotlib figure styling with several built-in themes
-
Tools for choosing color palettes that faithfully reveal patterns in your data